The markets are quiet before the U.S. CPI released on Wednesday (10th May). U.S. equity markets moved sideways while the dollar index and gold prices have little change as the market is digesting the renewed banking sector risk as well as developments regarding the U.S. debt ceiling. On the other hand, Australia is set to have its first budget surplus in 15 years as the Aussie government aims to keep fiscal and monetary policy aligned against inflation. However, the implementation of a less aggressive monetary policy may weaken the Australian dollar. Additionally, the recent release of China’s trade balance figures has indicated a higher-than-anticipated trade surplus, indirectly signalling the resilience of the Chinese economy. This development may contribute to further upward pressure on oil prices.
Current rate hike bets on 14th June Fed interest rate decision:
Source: CME Fedwatch Tool
0 bps (90.4%) VS 25 bps (9.6%)


The US Dollar’s struggle to find stability, combined with the cautious stance of the Federal Reserve and the ongoing debt ceiling negotiations, has created an atmosphere of uncertainty in financial markets. Investors closely watch for any signals from the Federal Reserve regarding the future of interest rates, while also assessing the impact of the upcoming inflation report.
The Dollar Index is trading higher following the prior rebound from the support level. MACD has illustrated diminishing bullish momentum. However, RSI is at 50, suggesting the index might consolidate within a range since the RSI is near the midline.
Resistance level: 101.65, 102.25
Support level: 101.10, 100.80

Gold prices have continued their bullish trend as the Federal Reserve’s cautious stance and the ongoing debt ceiling negotiations have created an atmosphere of uncertainty in the financial markets. Investors remain on edge, closely monitoring any signals from the Fed about the future of interest rates, as well as the impact of the upcoming inflation report. The looming threat of a US default has added an additional layer of concern, as President Biden and Congress scramble to find a resolution before the end of May. With the country’s massive debt burden at stake, a failure to reach an agreement could lead to a potential financial catastrophe, further bolstering the appeal of gold as a safe-haven asset for investors.
Gold prices are trading higher while currently near the resistance level. MACD has illustrated diminishing bearish momentum. However, RSI is at 50, suggesting the commodity might consolidate within a range as the RSI stays near the midline.
Resistance level: 2045.00, 2080.00
Support level: 1980.00, 1940.00

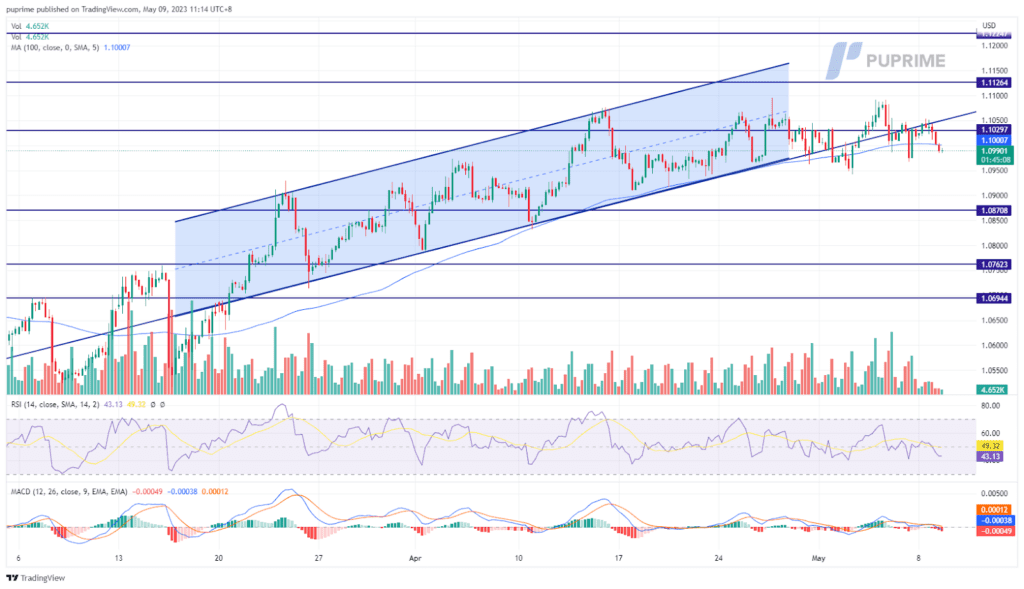
The euro performed poorly against the weakening dollar since the start of the week. Although the market widely expects a 25 bps rate hike, there are some dividing views among ECB officials with a poorer-than-expected economic outlook in the economic bloc. The ECB chief economist Philip Lane started to discuss disinflation in the region, although he still warns that the inflation is still high. On the other side, the U.S. CPI reading is due to release on the coming Wednesday (10th May); a higher reading may further strengthen the dollar and pressure the euro to trade lower.
The euro is trading stagnant and has fallen out of the uptrend channel. The RSI has been hovering below the 50-level while the MACD is breaking below the zero line, suggesting that the bullish momentum is diminishing.
Resistance level: 1.1126, 1.1225
Support level: 1.0871, 1.0762

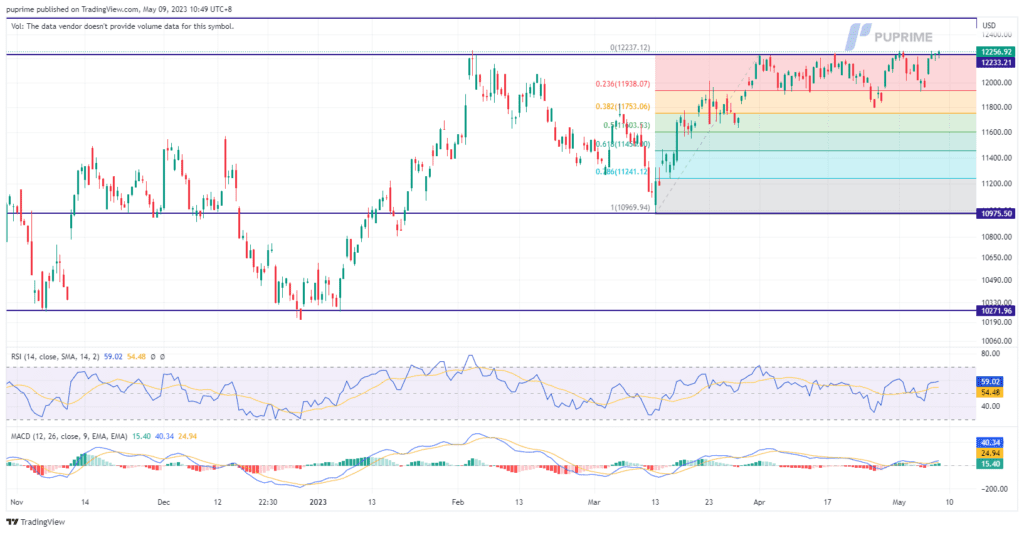
On Monday, the Nasdaq Composite gained 19.31 points, or 0.16%, to 12,254.72 following a rally on Friday driven by positive jobs data. However, the market struggled to find a clear direction amid the need for more positive news to sustain the rally. Investors are now focused on upcoming economic indicators, including the Labor Department’s inflation reading, which is expected to show an increase in the consumer price index for April. Other weekly data lined up include producer prices, weekly jobless claims, and consumer sentiment.
The trend for the Nasdaq is still moving near its previous high of 12264 points, which is a crucial area for investors to monitor closely for a possible break above. MACD indicator suggests a bullish momentum for the market. Meanwhile, the RSI is 59, indicating that the market is currently in a slightly bullish territory but not yet overbought.
Resistance level: 12267, 12536
Support level: 11961, 11771

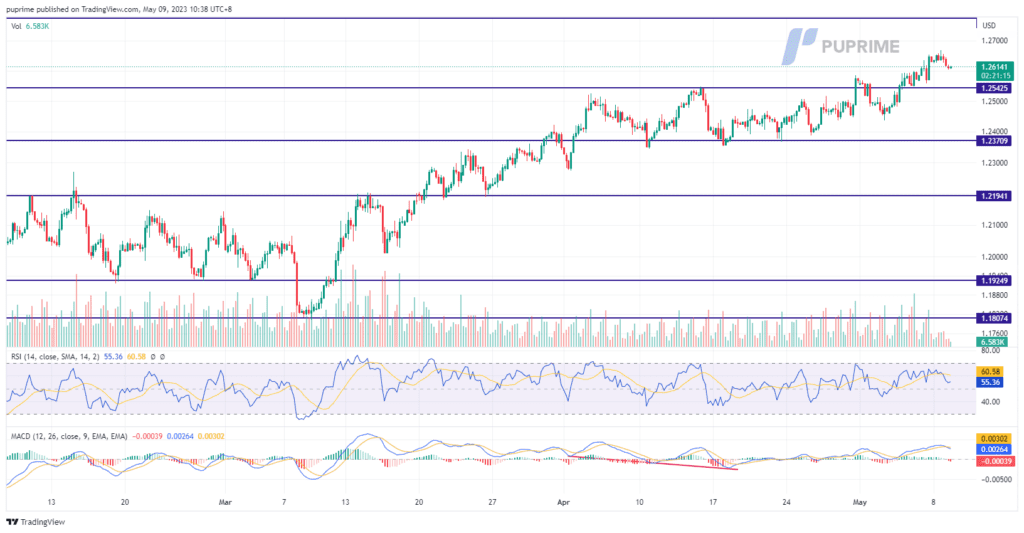
On Monday, the pound approached a one-year high at $1.2668 ahead of the Bank of England’s policy meeting as they expected to increase interest rates to 4.5% to combat high inflation. Despite concerns about the cost of living and economic slowdown, the U.K. economy has remained resilient. Therefore, the upcoming BoE meeting will be crucial for furthering the pound’s value. As the Bank of England’s decision draws nearer, investors are watching closely for signs of how the central bank may respond to the current economic climate.
The pound has surged to a one-year high against the U.S. dollar, with the MACD confirming the trend and the RSI trading at 55, indicating bullish sentiment. It could further drive the pound’s recent gains, especially as the Bank of England is expected to raise interest rates soon.
Resistance level: 1.2774, 1.2973
Support level: 1.2542, 1.2371

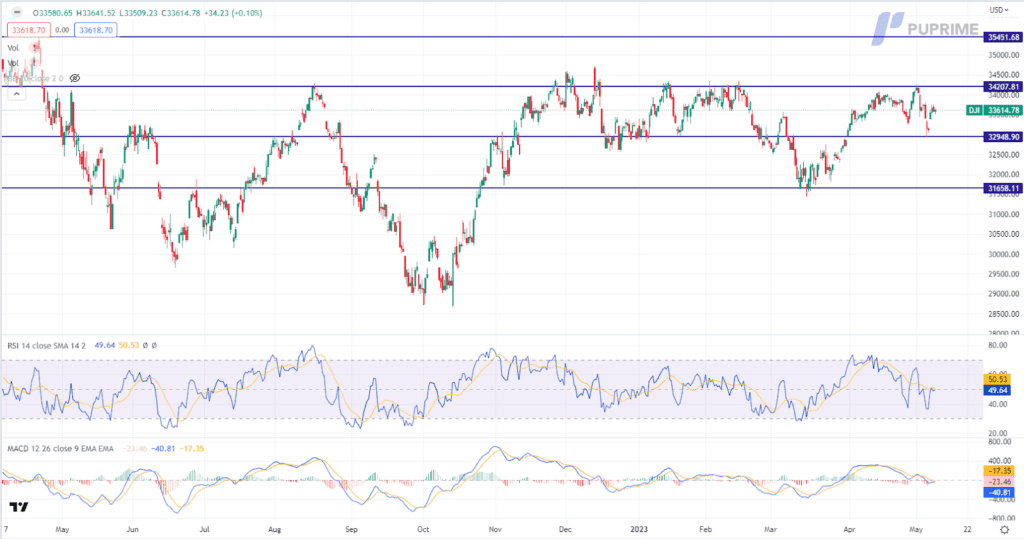
The Dow Jones continue to consolidate within a narrow range as investors eagerly await catalysts that could drive significant market movements. Among these catalysts is the impending release of the consumer inflation report scheduled for Wednesday. This report gains particular importance as it comes on the heels of Friday’s data, which revealed a robust labour market performance in April, exceeding expectations and unexpectedly lowering the unemployment rate. These positive signals have raised hopes for a strong US economic recovery.
The Dow is trading flat following the prior rebound from the support level. MACD has illustrated diminishing bearish momentum, while RSI is at 50, suggesting the index might continue to trade within a range as the RSI stays near the midline.
Resistance level: 34205.00, 35450.00
Support level: 32950.00, 31660.00

The recent surge in oil prices can be attributed to an improved economic outlook, primarily driven by positive developments in the US labour market. A healthy jobs report for April has instilled confidence in the oil demand, overshadowing concerns of a potential economic downturn. While the strength of the labour market may prompt the Federal Reserve to maintain higher interest rates for an extended period, the positive prospects for oil consumption have been a key driver of the market’s current momentum.
Oil prices are trading higher while currently testing the resistance level. MACD has illustrated increasing bullish momentum, while RSI is at 59, suggesting the commodity might extend its gains after successfully breakout since the RSI stays above the midline.
Resistance level: 74.05, 76.60
Support level: 71.35, 67.95

以行业低点差和闪电般的执行速度交易外汇、指数、贵金属等。
