Jerome Powell delivered a smaller size of rate hike of 25 bps which is in line with the market consensus; however, the market was hit by double assail with U.S. major indexes dropping by more than 1% and the dollar traded below $103. Firstly, Powell revealed that the Fed considered pausing the rate hike but prioritised fighting the high inflation and hinted for more rate hikes in the future if the inflation remained stubborn. Secondly, the U.S. Treasury Secretary commented that her team is not considering providing “blanket” insurance for banks and the lender should be held accountable for any wrongdoing. The Fed not being confident in raising higher interest rates and U.S. officials not backing financial institutions spurred gold prices to surge by more than 1.5% as the market condition is getting more uncertain. On the other hand, the U.K.’s CPI reading showed the country’s inflation climbed back to double digits and pushed the Pound Sterling to trade higher against the U.S. dollar. The BoE will announce its interest rate decision today (23rd March), a bigger rate hike may further strengthen the Sterling.
Current rate hike bets on 3rd May Fed interest rate decision:
0 bps (62.9%) VS 25 bps (37.1%)

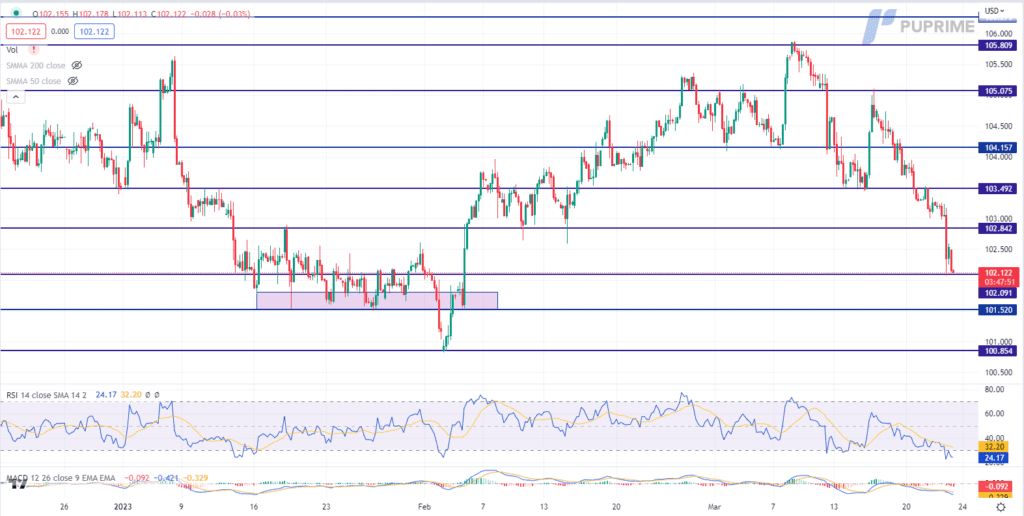
The Federal Reserve raised its benchmark interest rates by 25 basis points on Wednesday, while signalling that additional rate hikes may be on the horizon. Despite the hawkish stances adopted by the Federal Reserve, market participants remain unconvinced. US Treasury yields and the US Dollar have taken a significant hit following the monetary policy decisions, as investors bet that Powell’s confidence in the economic outlook would dwindle in the coming months. With the Fed’s interest rate projections primarily dependent on economic data, market participants are advised to remain vigilant in tracking any relevant developments.
The Dollar Index is trading lower following the prior breakout below the previous support level. However, MACD has illustrated diminishing bearish momentum, while RSI is at 28, suggesting the index might enter the oversold territory.
Resistance level: 102.85, 103.50
Support level: 102.15, 101.50
Gold prices surged in response to Federal Reserve Chair Jerome Powell’s recent press conference. The yellow metal received a boost from a drop in US Treasury yields and a widespread weakness in the US Dollar, which helped to prop up prices. As investors reacted to Powell’s comments and the Fed’s latest interest rate decision, gold prices experienced a sharp upswing, with market participants seeking out the safe-haven asset as a hedge against market volatility and economic uncertainty.
Gold prices are trading higher while currently testing the resistance level. MACD has illustrated diminishing bearish momentum, while RSI is at 60, suggesting the commodity might extend its gains after breakout since the RSI stays above the midline.
Resistance level: 1975.00, 2000.00
Support level: 1955.00, 1925.00
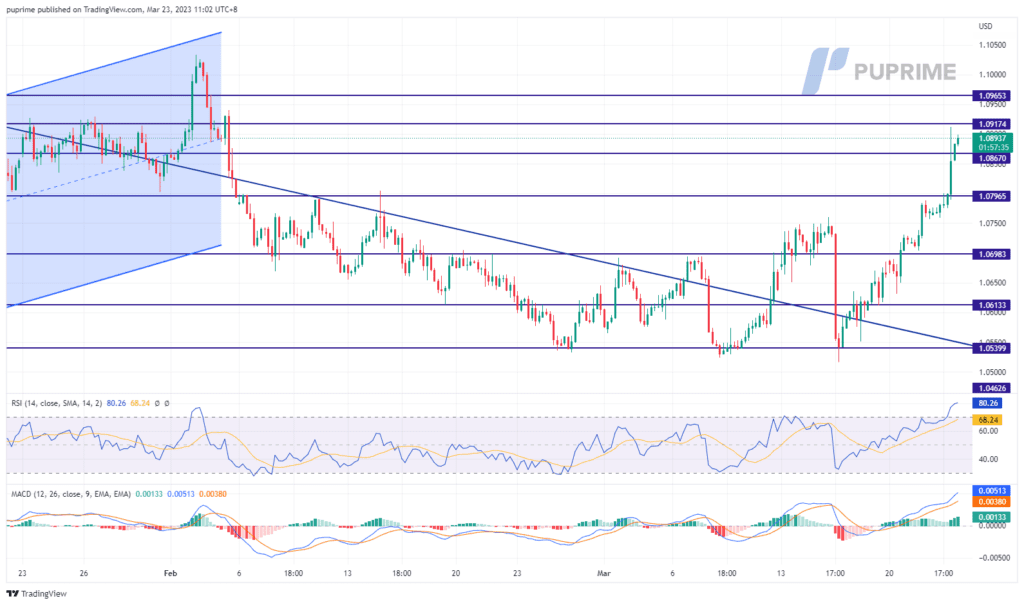
The Fed delivered a relatively small rate hike last night by 25 bps, which aligns with the market expectation. However, the dollar continues weakening and hovering just above $102. Despite Jerome Powell hinting for more rate hikes to come if the inflation in the U.S. is not satisfied by the Fed, the dollar has dropped by nearly 0.4% in this week. On the other hand, the market perceived that the ECB remained hawkish in its monetary tightening program and is expecting another 50 bps rate hike next round in May. To this date, the euro has gained about 2.15% against the dollar.
The indicators depict a solid bullish bias for the pair since the pair has broken through multiple resistance levels since past week. The RSI has hit above 80, suggesting a very strong buying power for the pair and the MACD continues to diverge above the zero line.
Resistance level: 1.0917, 1.0965
Support level: 1.0796, 1.0698
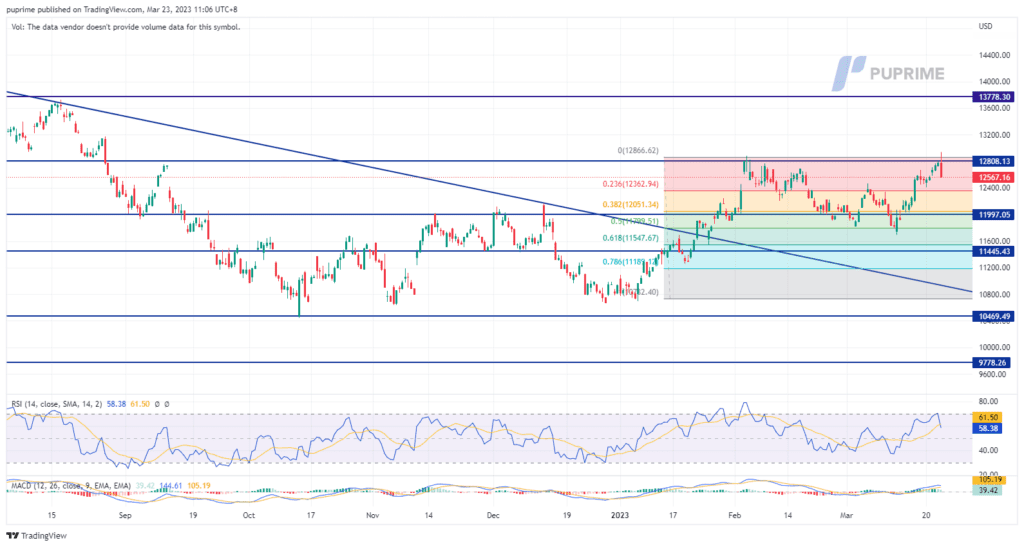
The Nasdaq index dropped 1.6% to 11,669 points on Wednesday after the U.S. Federal Reserve delivered a widely expected 25 basis point policy hike. In the Fed’s statement, the members of the Federal Open Markets Committee (FOMC) said some additional tightening might be possible but suggested it was on the verge of pausing future hikes because of the recent turmoil in the financial sector. In fact, investors were expecting the Fed to stop with this hike, expressing their displeasure that the rate hikes might continue for one or two more meetings. Worries persist that the Fed’s aggressive battle against inflation could tip the economy into recession, and recent turmoil in the banking sectors has exacerbated market fears.
The index has a slight pullback after it touches its resistance level of 12800 points on Wednesday as market participants remain sceptical. MACD has illustrated bullish momentum ahead. RSI is at 58, indicating a bullish momentum in the near term.
Resistance level: 12808, 13778
Support level: 11997, 11445
On Wednesday, the pound rose 0.73% to $1.2318 against the weakened dollar after the Fed increased a 25 basis point hike. Despite the Fed’s hawkish tone, concerns about the banking system could be exacerbated by Yellen’s contrasting comments that dampened investor confidence. Hence, the dollar dropped significantly, prompting the pound to rise. Secondly, UK CPI data shows an unexpected rise to 10.4% in February, lifting the pound on the expectation of higher interest rates. Traders bet on the BoE to increase a 50 basis points interest rate hike. Furthermore, the BoE’s rate hike decision will be released later today so that investors can keep an eye on it for further trading signals.
Moreover, the pound has broken its resistance level of $1.2300 and is trading at $1.2313 as of writing. MACD has illustrated a neutral-bullish momentum ahead. RSI is at 66, indicating the pair’s movement remains strong.
Resistance level: 1.2435, 1.2613
Support level: 1.2300, 1.2211
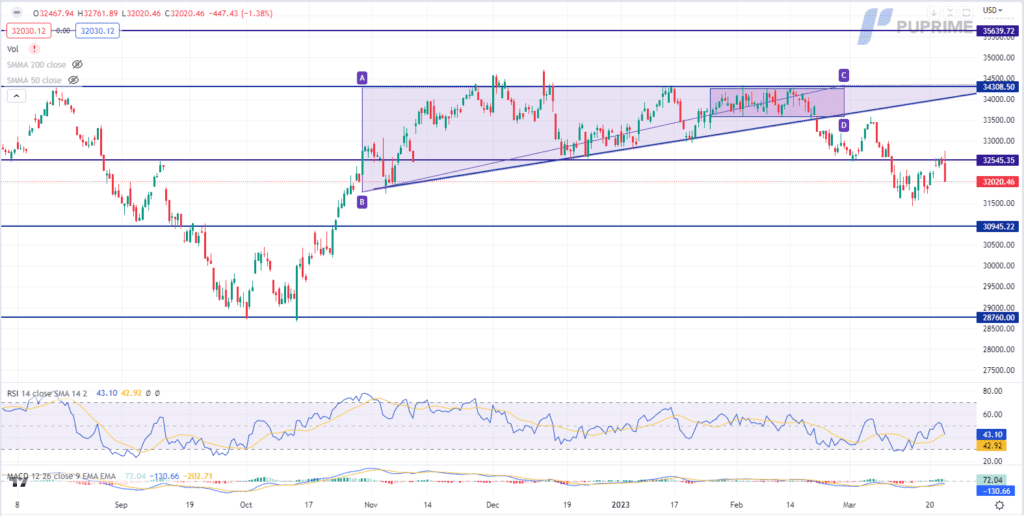
The Dow Jones Industrial Average tumbled as investors grappled with concerns over the negative impact of the Federal Reserve’s latest rate hike. The central bank’s decision to raise interest rates by 25 basis points, bringing the benchmark rate to 4.75%-5.00%, was widely anticipated by the market. However, the Fed’s pledge to maintain its tightening monetary policy has fueled fears of a potential economic downturn, with investors increasingly wary of the impact on risk assets such as major US benchmark stock indices.
The Dow is trading lower following the prior breakout below the previous support level. MACD has illustrated diminishing bullish momentum, while RSI is at 43, suggesting the index might extend its losses toward support level.
Resistance level: 32545.00, 34310.00
Support level: 30945.00, 28760.00
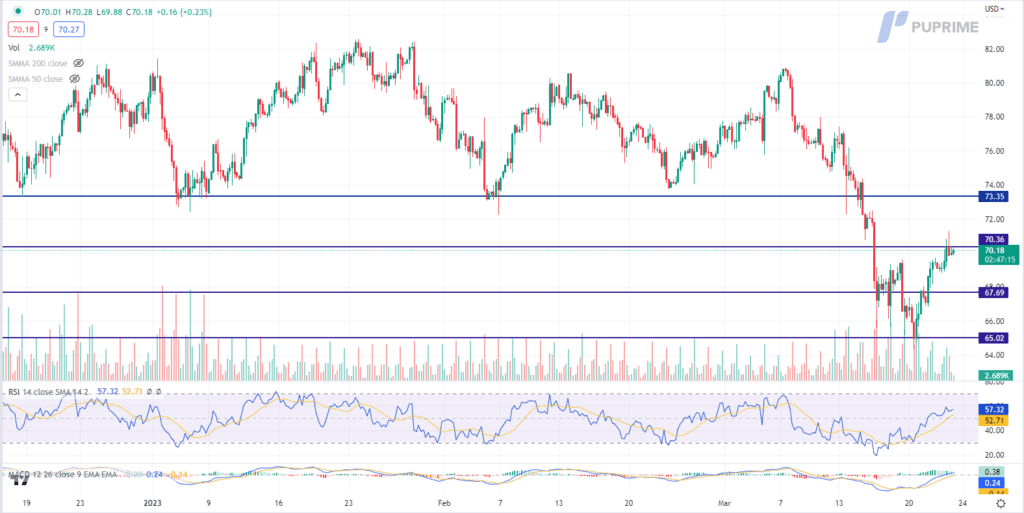
Oil prices experienced a slight pullback in the wake of the release of US inventory data, which revealed a surge in American oil inventories to a 22-month high. According to the US Energy Information Administration (EIA), inventories increased by 1.063 million barrels last week, exceeding market projections of a decline of 1.565 million barrels. This unforeseen development may have caused some consternation in the oil market, but the long-term outlook remained bullish, with demand for commodities denominated in the US Dollar receiving a significant lift as the greenback continued its downward spiral following the Federal Reserve’s latest interest rate decision.
Oil prices are trading lower following the prior retracement from the resistance level. However, MACD has illustrated increasing bullish momentum, while RSI is at 56, suggesting the commodity might trade higher in short-term as technical correction since the RSI stays above the midline.
Resistance level: 70.19, 73.35
Support level: 67.69, 65.36

以行业低点差和闪电般的执行速度交易外汇、指数、贵金属等。