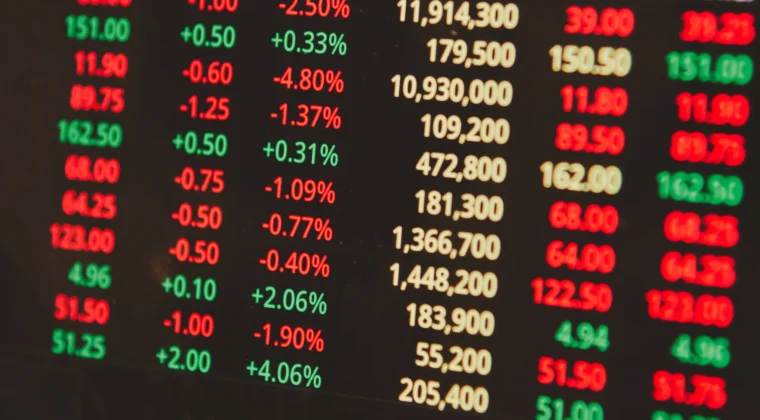
Trading indices is a popular way for investors and traders to gain exposure to the overall performance of a market or specific sector. Indices track the performance of a group of stocks, providing a convenient and cost-effective way to invest in a basket of stocks rather than having to buy and manage individual stocks. With the rise of online trading platforms and low-cost brokerage services, it’s now easier than ever for individuals to trade indices. However, with the ease of access comes the need to have a well-designed trading strategy to navigate the markets and achieve the desired results. In this article, we will discuss some popular indices trading strategies used by traders.
The Trend Trading Strategy involves identifying the direction of the market trend and following it until it shows signs of reversal. Traders use various technical indicators, such as moving averages, to determine the direction of the trend and make their trades accordingly. The idea behind this strategy is to buy into an index when it is trending upwards and sell when it is trending downwards. This strategy can be effective in trending markets where the index is moving in a clear direction for an extended period.
Breakout trading is a popular strategy used in indices trading, where traders aim to identify key levels of support and resistance and then enter trades when prices break through these levels. The idea is that once a price breaks through a key level, it is likely to continue moving in the same direction, providing a trading opportunity.
Here are the steps for implementing a breakout trading strategy for indices trading:
Identify key levels of support and resistance: Use technical analysis tools such as trend lines, moving averages, and chart patterns to identify key levels where prices have historically found support or resistance.
Confirm the breakout: Wait for price to actually break through the key level before entering a trade. This helps to avoid false breakouts and increases the chances of a successful trade.
Enter a trade: Once a price has broken through a key level, enter a trade in the direction of the breakout. It’s important to have a predetermined stop loss in place to limit potential losses in case the trade doesn’t go as planned.
Interested To Find Out More About Indices Trading

A Bollinger Band entry trading strategy is a popular method used in index trading. The strategy involves using Bollinger Bands, which are plotted two standard deviations away from a simple moving average, to determine entry and exit points for trades. Here’s how the strategy works:
Identify the trend: The first step in the Bollinger Band entry strategy is to determine the trend of the index you’re trading. If the index is in an uptrend, you’ll look to buy, and if it’s in a downtrend, you’ll look to sell.
Look for the squeeze: The second step is to look for a “squeeze” in the Bollinger Bands, which occurs when the bands narrow and price is contained within them. This squeeze is a sign of a potential trend reversal.
Wait for the breakout: After a squeeze has been identified, you’ll want to wait for a price breakout. If the index is in an uptrend, you’ll look for price to break above the upper Bollinger Band, and if it’s in a downtrend, you’ll look for price to break below the lower Bollinger Band.
Enter the trade: Once a breakout has occurred, you can enter a trade in the direction of the breakout.
Place a stop loss: To protect your trade, it’s important to place a stop loss order. This can be placed just below the lower Bollinger Band if you’re in a long trade or just above the upper Bollinger Band if you’re in a short trade.
Take profits: Finally, you’ll want to have a plan for taking profits. This could involve taking profits at a specific price target, or using a trailing stop to capture profits as the trade moves in your favour.
Mean reversion trading strategy in indices trading refers to a trading approach based on the idea that the price of a stock market index will eventually move back towards its average or mean value over time. This strategy is based on the assumption that prices and returns that deviate significantly from their historical average are likely to revert back to their average.
In the context of indices trading, mean reversion strategies are used to identify when an index is overvalued or undervalued relative to its historical average, and to take advantage of this deviation by buying low and selling high. For example, if a stock market index has been consistently trading above its historical average for a period of time, a mean reversion trader might expect the index to eventually return to its average and therefore look for opportunities to sell the index at a higher price.
Mean reversion trading strategies in indices trading can be based on various statistical methods, including time series analysis, co-integration, and statistical arbitrage. These methods are used to determine the average price or return of an index and to identify opportunities for buying or selling based on the deviation from the average.
In conclusion, these are some of the popular indices trading strategies used by traders. No single strategy works best in all market conditions, and it’s crucial to have a well-rounded approach that takes into account multiple factors, such as market trends, economic indicators, and risk management. It’s also important to remember that successful trading requires discipline, patience, and the ability to manage risk. Traders should always strive to continuously improve their knowledge and skills and seek professional guidance when necessary.
Start Trading Indices With Competitive Spreads

以行业低点差和闪电般的执行速度交易外汇、指数、贵金属等。
